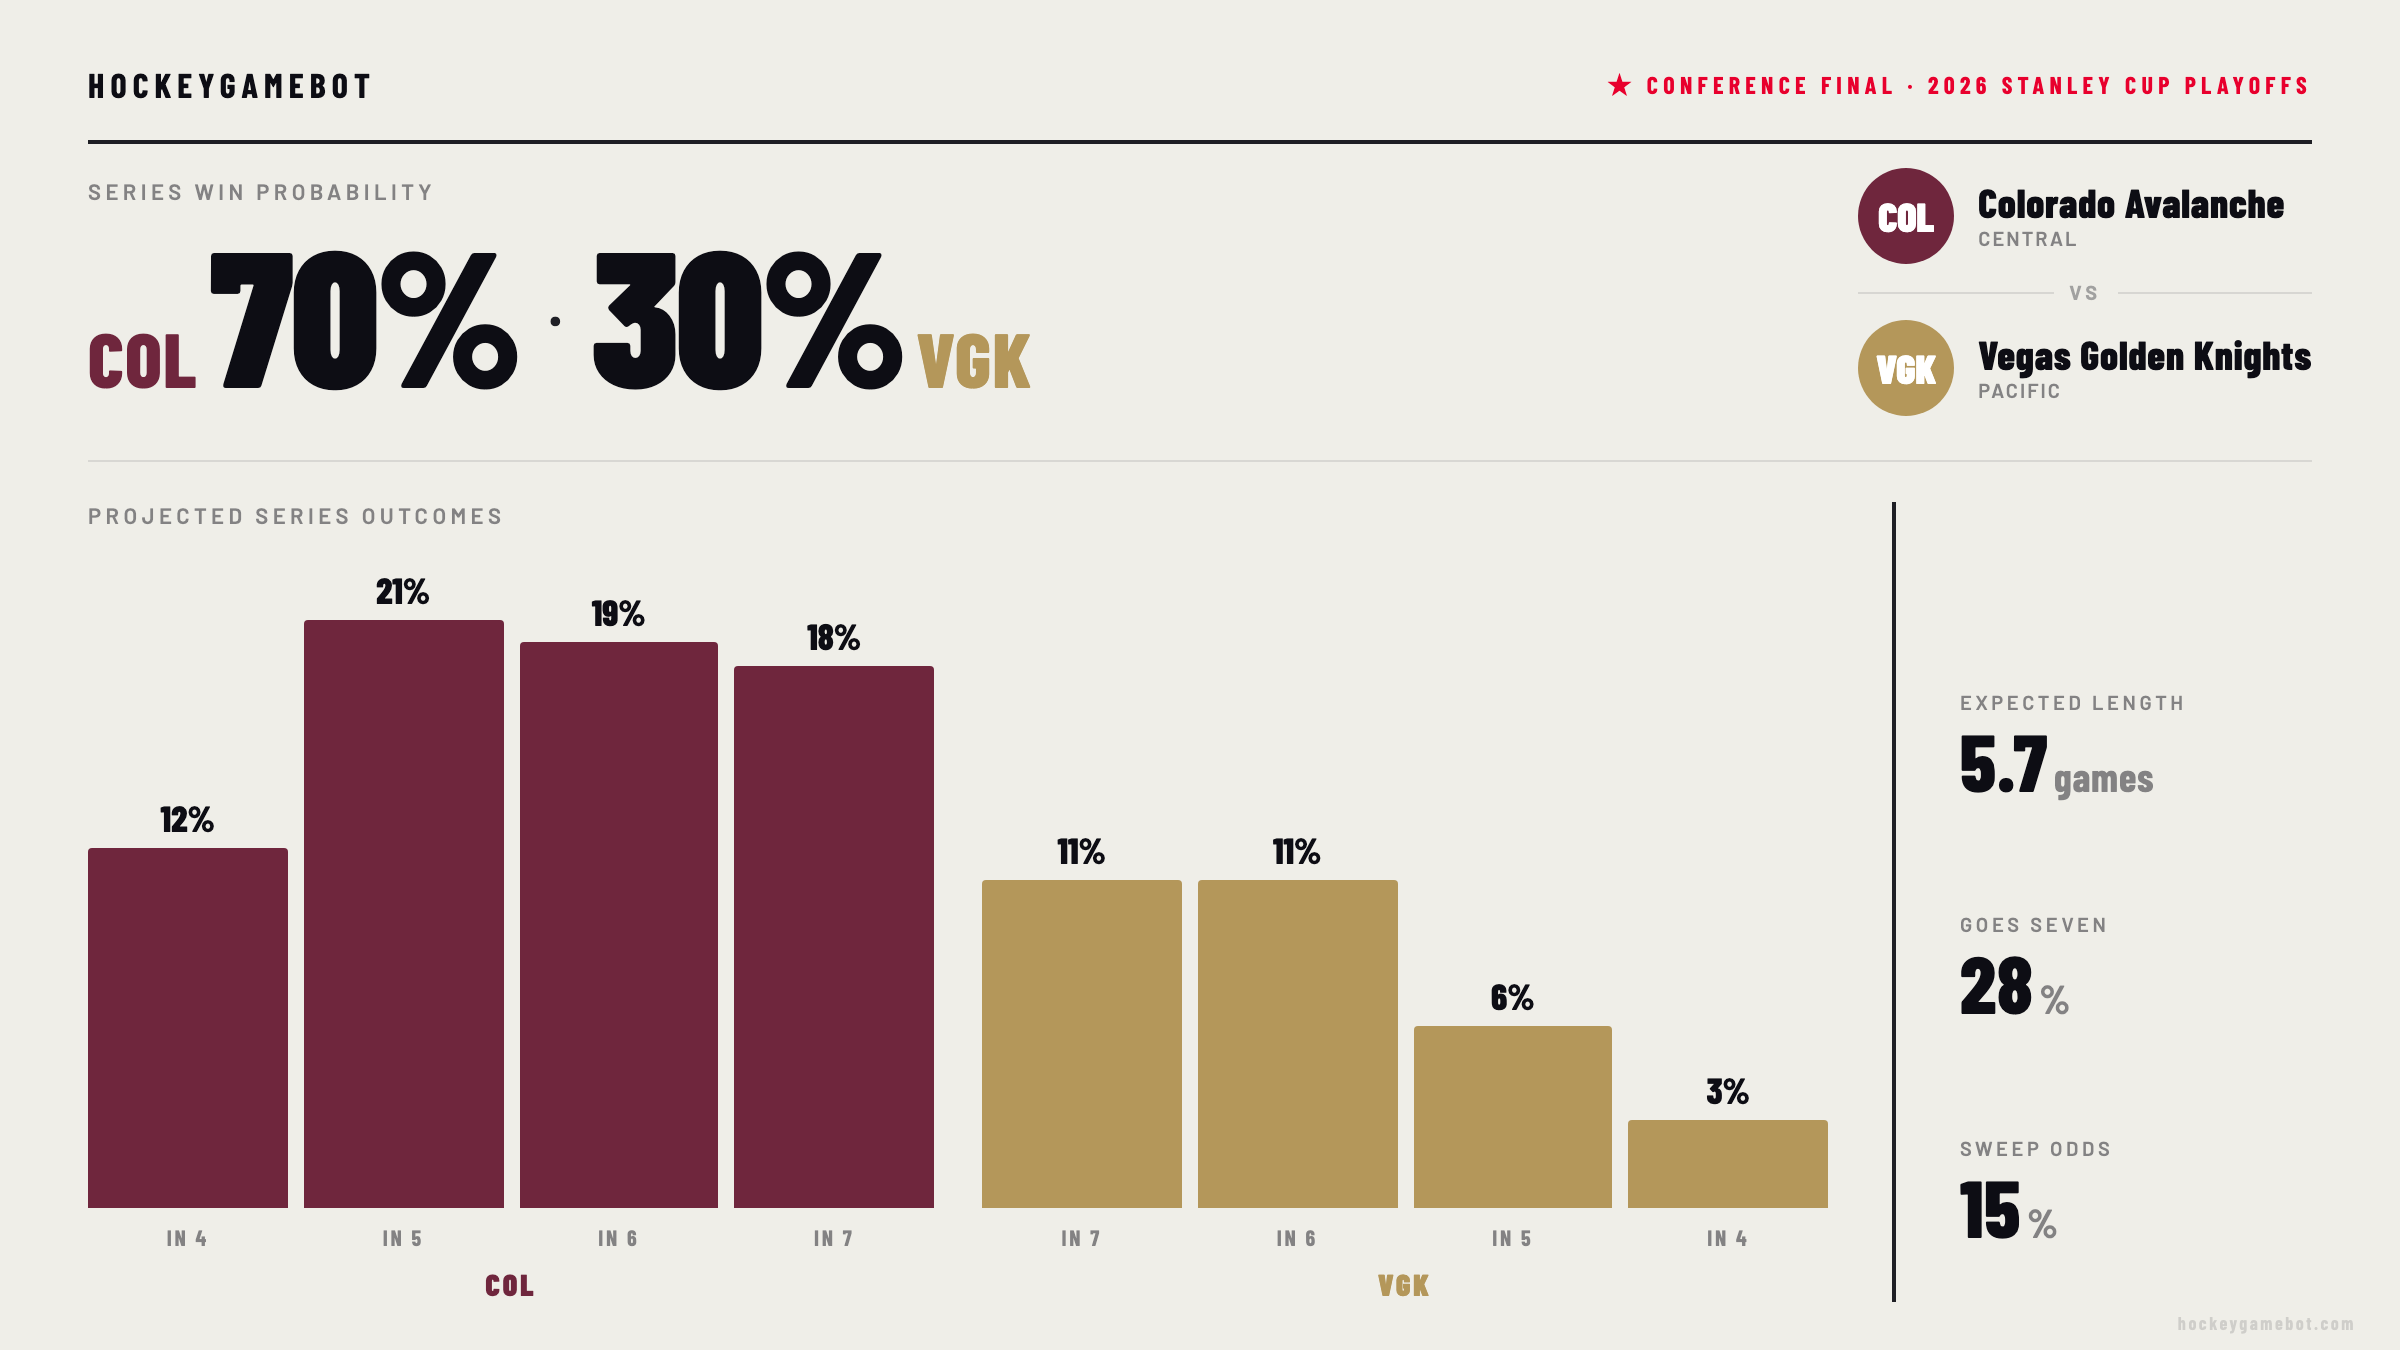
The last two Western Conference champions meet tonight in Game 1. Colorado has been the most dominant team in these playoffs — they swept the Kings, beat Minnesota in five, and are scoring at 4.02 G/60 with a 56% xGF% at 5v5. That dominance is real. Vegas has been tested, winning two 4-2 series, but at 5v5 their xGF% sits at 50.6% — basically a coin flip. They’ve been winning games, not dominating play. Mitch Marner is having the playoff of his career (18 points in 12 games, leading all scorers) and Eichel is right behind him at 15. But the model sees the gap between winning and controlling and gives Colorado a 70% chance to reach the Stanley Cup Final. Vegas has been here before — it’s their fifth Conference Final in nine seasons — and history says don’t count them out.
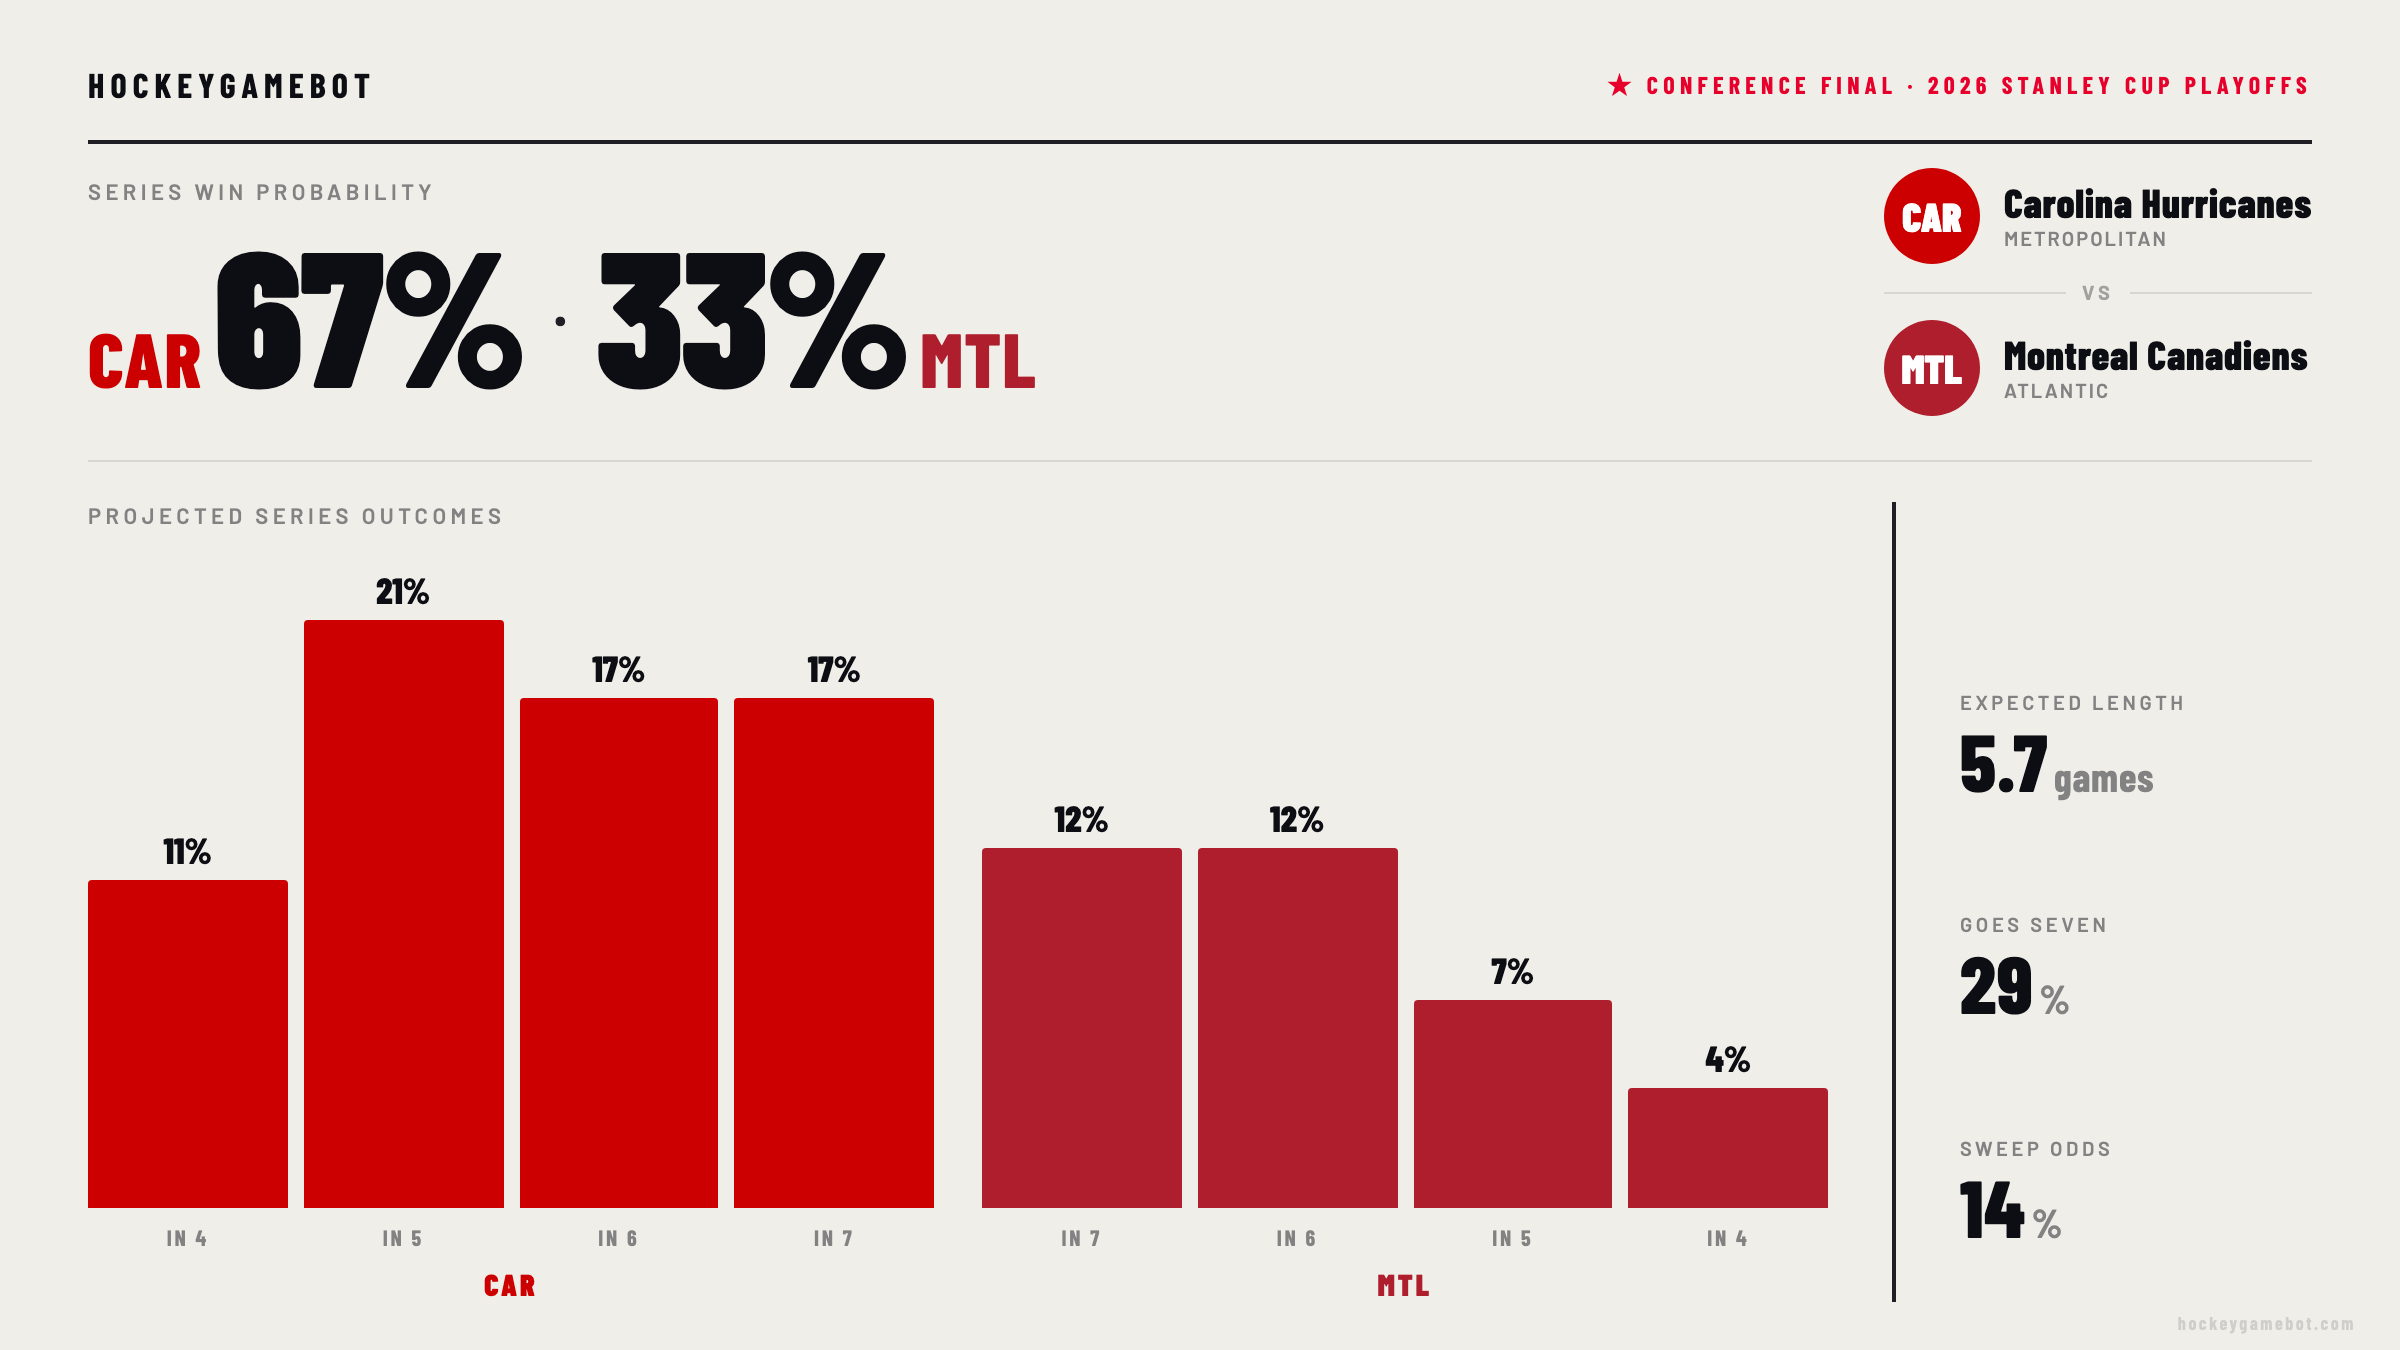
In the East, it’s a different kind of series. Carolina is 8-0 and hasn’t allowed more than a handful of goals across two rounds. Frederik Andersen is at +14.59 GSAx in 8 games, the highest of any playoff goalie this year by a wide margin. Montreal got here the hard way — back-to-back Game 7 road wins — and Jakub Dobes is at +9.87 GSAx, second only to Andersen. The two best playoff goalies in the field are about to face each other Thursday in Raleigh. Montreal also won all three regular-season meetings against Carolina, outscoring them 15-8. But the underlying numbers tell the real story: Carolina’s 5v5 xGF% in the playoffs is 55.47%, Montreal’s is 45.88%. The Habs have been winning on margins the play doesn’t support, and the model has Carolina at 67%.
The model likes Colorado in the West and Carolina in the East. Both have the underlying numbers to back it. Both series have a counterfactual that makes the upset credible — Vegas’s championship pedigree, Montreal’s head-to-head dominance in the regular season. Check back here after each round for updated model numbers and series breakdowns. In the meantime, the playoff lines data and goalie GSAx leaderboard are live if you want to dig into the numbers yourself.